In Massachusetts, we have been throwing away more than 5 million tons of waste each and every year for over a decade. It’s dirty, polluting, expensive and unsustainable. Communities across the Commonwealth are making the call for a goal of Zero Waste.
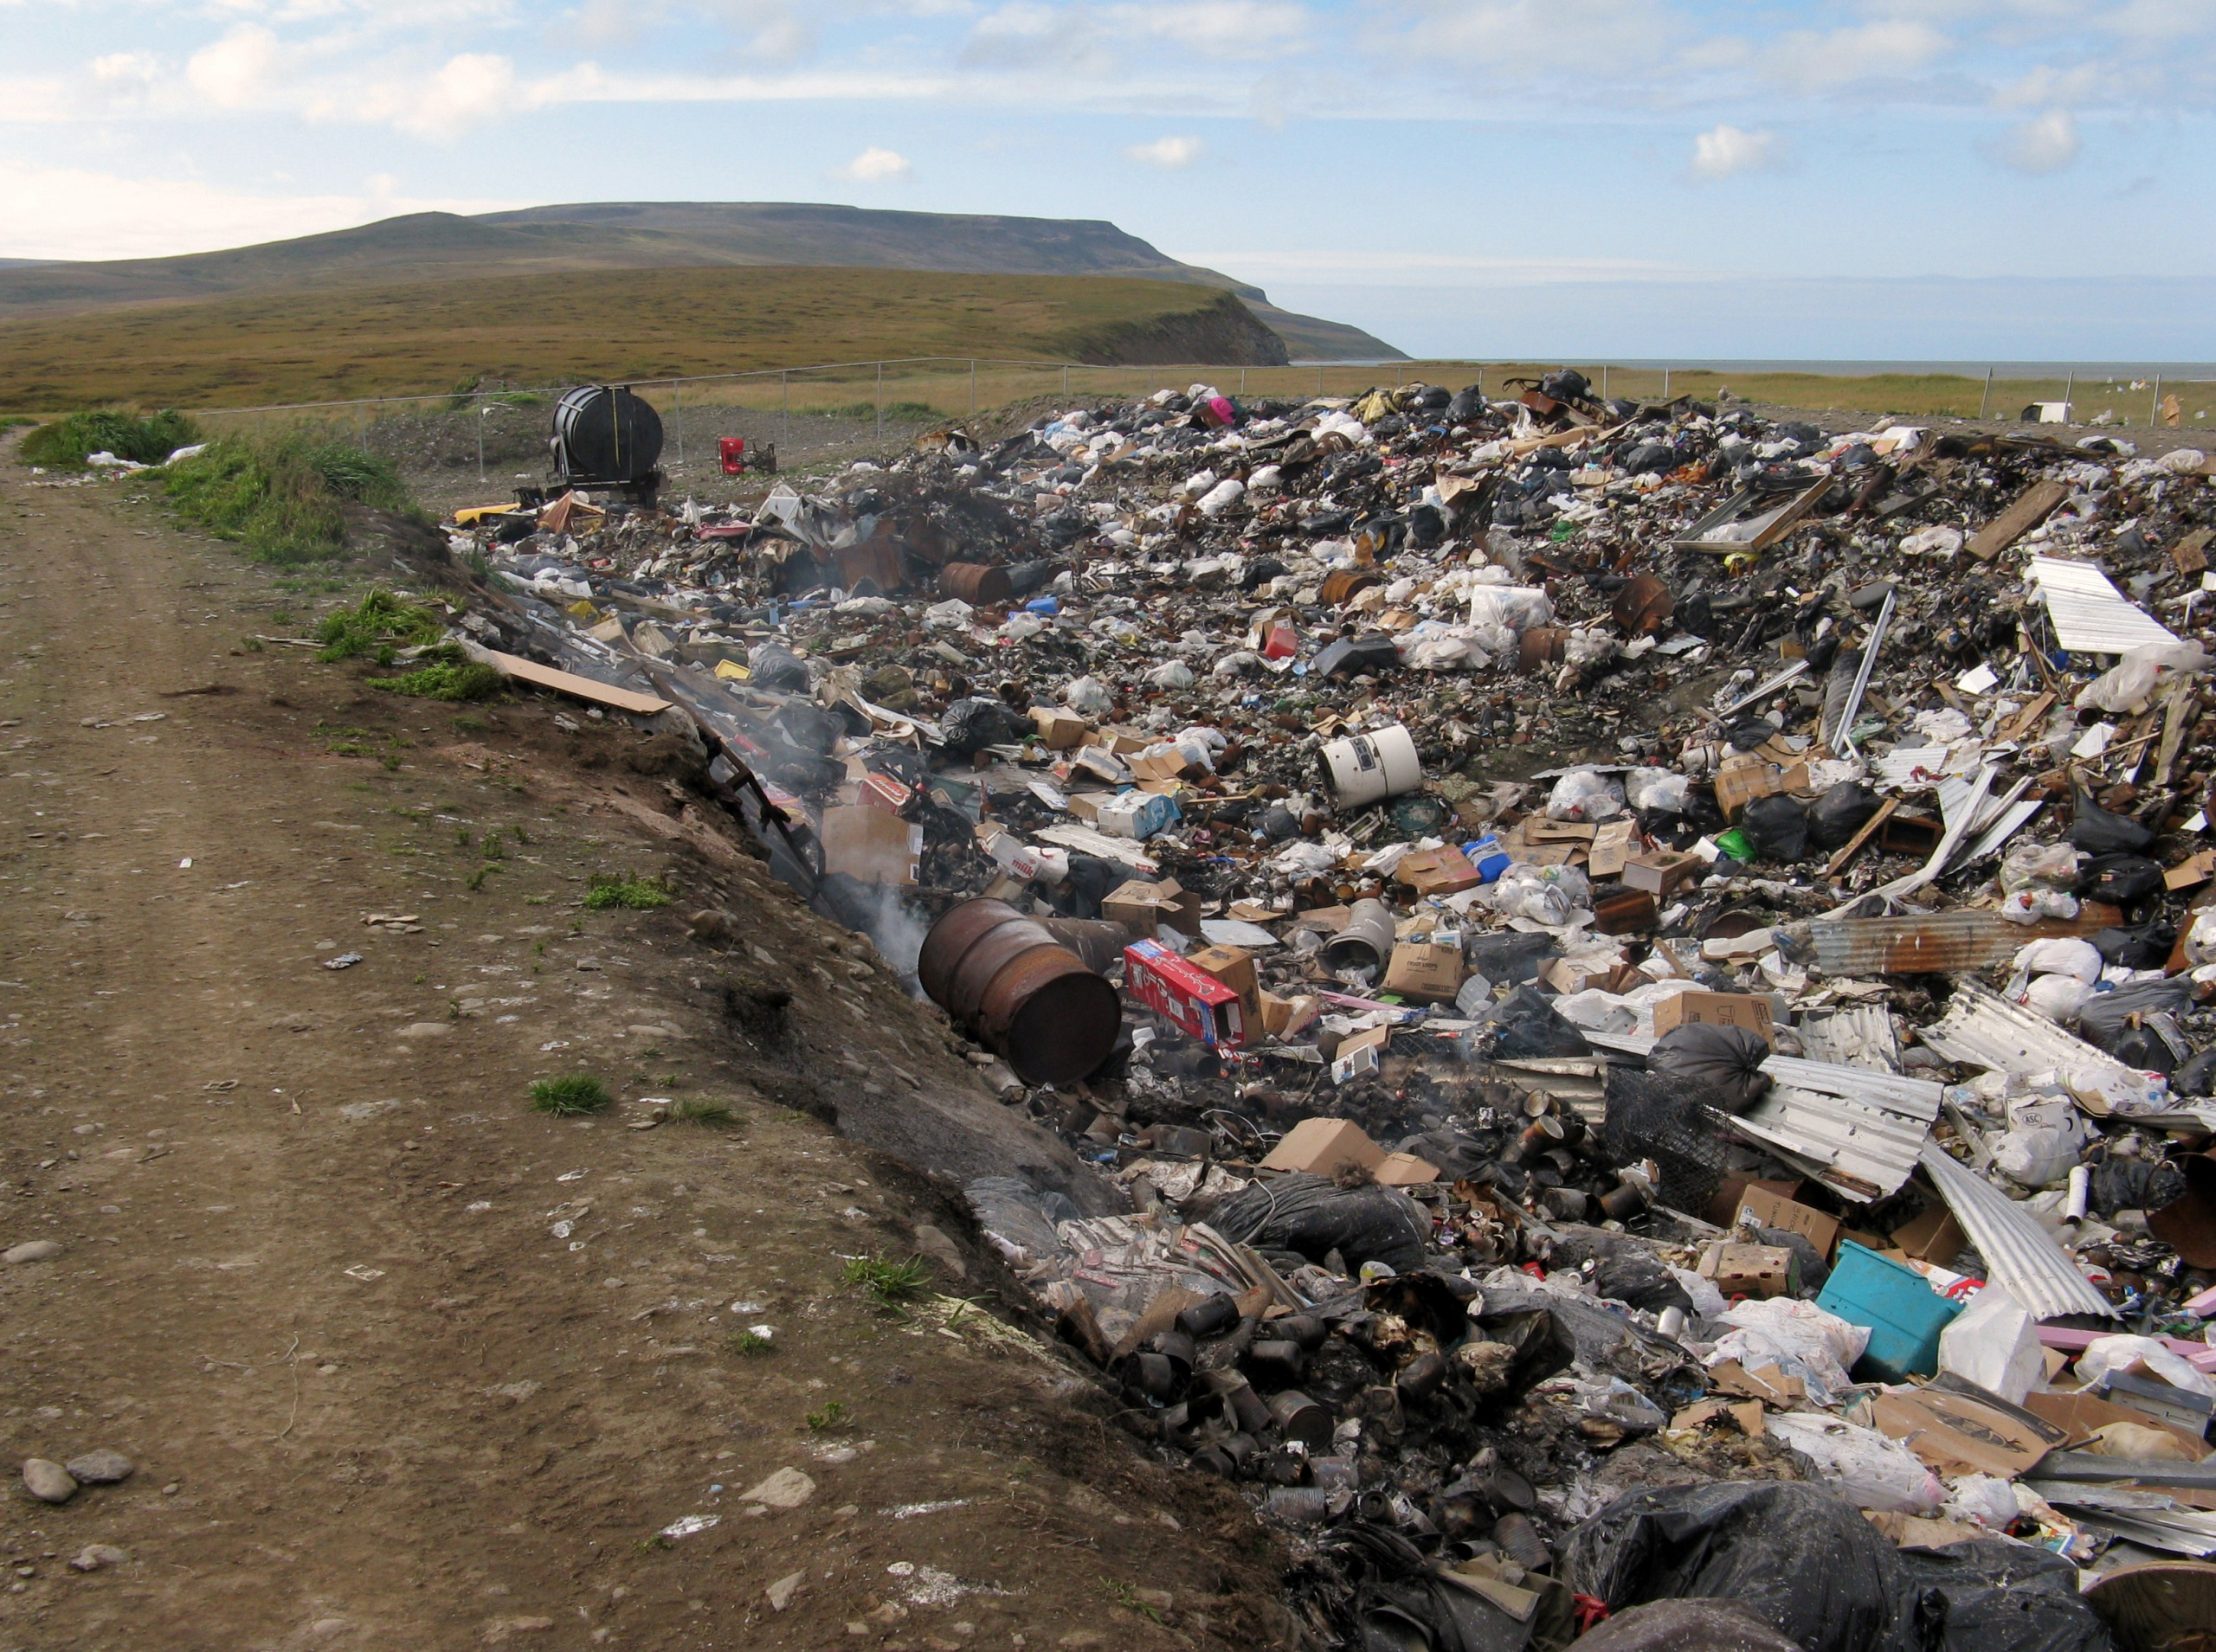
In Massachusetts, we have been throwing away more than 5 million tons of waste each and every year for over a decade.[1] It’s dirty, polluting, expensive and unsustainable. Communities across the Commonwealth are making the call for a goal of Zero Waste.
The term “Zero Waste” is often met with skepticism because it seems like an unrealistic goal at first. But there are cities, states and countries which have set this goal and are already on their way to reaching it. Instead of sending our resources to landfills and incinerators, we can divert a majority of what we throw away from waste facilities–which are toxic and polluting.
The policy goal of Zero Waste needs to be a priority because our trash does not simply disappear. The Massachusetts residents who live with incinerators and landfills in their communities know this all too well. When trash is burned, it releases toxic chemicals, causing devastating health problems for those forced to breathe this pollution.[2] Incineration also produces methane, a potent climate change pollutant. Burying our trash isn’t much better; landfills often leak, contaminating local bodies of water. What’s more, the communities at the frontlines are often working class, Black, Indigenous, People of Color communities, and should not be forced to bear the consequences of our state’s waste problem. We need a Zero Waste future to protect the ealth and safety of Massachusetts communities and our planet.
The basis for these calculations is that residents of Massachusetts consume and throw out waste in similar proportions to the rest of the United States. The official percentages of different waste categories are based on MSW generated by the entire nation in 2018, the most recent national waste statistics. This data is then applied to Massachusetts’ waste consumption, calculating an approximate amount of tons for each waste category.
It’s easier to imagine Zero Waste when you look at the numbers behind what we are throwing away:
Food and Yard Waste (33.7%):
Food and yard waste (aka ‘organic’ waste) combined make up the largest waste category, with Massachusetts producing approximately 1,907,420 tons of organic waste each year. There are already solutions to completely eliminate these tons of waste from our landfills and incinerators: breaking down organic matter through large-scale composting facilities and anaerobic digesters. The anaerobic digestion process is when organic materials are broken down by microorganisms, producing biogas, a renewable energy source.[3] When food and other organic matter is burned or breaks down in a landfill instead of being reused, it releases carbon dioxide and methane, fueling climate change. Local governments need to create robust, accessible composting systems in order to dispose of organic waste in a sustainable manner.
Some towns and cities in the state–like Hamilton and Wenham– have successfully piloted curbside composting pick-up programs.[4] The best recipients for the compost created by these programs are local farms. Composting not only reduces pollution, but is beneficial to enhance the soil at farms. Many cities around the country have already fully adopted this solution, providing a blueprint for Massschusetts communities to follow. For example, San Francisco adopted a comprehensive composting program in 1996 and has achieved over a 80% diversion rate since 2012, the compost going to local farms.[5] In Massachusetts, Worcester has the largest composting program in the state, providing a drop-off option for yard waste as well as free compost available for pick-up.[6] In Massachusetts there are over 50 sites that accept diverted organic waste, including anaerobic digesters and composting facilities.[7] Yet in order to achieve a Zero Waste future, we need these programs and facilities to be expanded to accommodate all of the state’s organic waste.
Paper and Paperboard (23%):
Paper makes up the second largest portion of waste: more than 1.3 million tons of paper products were used in 2018. First of all, paper was banned from disposal by the DEP in 1994, because paper products can easily be recycled.[8] We could remove a fourth of our waste by simply following recycling guidelines already in place in the state. Paper recycling has plateaued over the years, but there is potential to increase recycling rates and expand curbside recycling pick-up.[9] Just like when organic materials are burned, burning paper releases huge amounts of carbon into the atmosphere. Although paper is recycled at higher rates than other materials, diversion rates can be even higher. It is estimated that the most recent data, shows that only 37% of the fibers used to make paper products come from a recycled source, and there is room to grow this percentage.[10] When paper is recycled, 37.8% is made into corrugated boxes, 35.7% is exported overseas, 12.2% is made into boxboards, 8.4% is recycled into tissue, and 5.8% is used for newsprint & other paper.[11]
Increasing our paper recycling not only reduces carbon emissions and pollution but also has economic benefits. In addition, when paper products are separated from other materials in curbside recycling programs as they were not that long ago in many cities and towns, the recycling is more valuable, has lower rates of contamination, and is less expensive to process.[12] Research has shown that there is a market for separated paper products, whereas mixed paper has less value in U.S. markets. Nick Doyle, recycling sales manager of TOMRA Sorting Recycling, points out that “while there isn’t money in mixed paper, there is money if this commodity is further separated.”[13] Clearly, there is economic potential for separated recycling, and if paper recycling is improved, it can meet the demands of the market.
Plastics (12.2%):
Contrary to what the manufacturers would have us all believe, with the number and recycling symbols embossed on most plastic products, a small percentage of plastics are actually recyclable. In 2018, less than 9% of plastics were recycled, the remaining 91% ending up in a landfill or incinerator.[14] The years it takes for plastic to fully break down depends on the type of plastic and product, ranging from 20 years to 450 years.[15] Plastic fills our waste facilities, but can also damage the health of wildlife from the abundance of pollution in our oceans and aquatic ecosystems. Yet in order to reduce plastic’s presence, recycling is not the most comprehensive solution.
We need to halt plastic in its stages of production and consumption, encouraging sustainable alternatives. Although most of us encounter plastic products in our daily lives, we do not need plastic and single-use products, as there are other alternatives. Many cities and companies internationally have successfully instituted plastic bag bans, limited plastic straw usage on a request-only basis, implemented polystyrene (styrofoam) bans, and are aiming to ban all single use plastics in the near future. Plastics are made from natural gas, a finite resource and fossil fuel, and when plastics are burned in an incinerator, they release cancer-causing dioxins, lead, mercury, and hydrochloric acid.[16] For the sake of the health of our planet, wildlife, and people, we need to change course and reimagine our plastic usage.
Metals (8.8%):
Over 495,816 tons of metals were disposed of in 2018. This waste material includes ferrous metals (iron and steel), aluminum, and nonferrous metals (lead, copper, and zinc). Ferrous metals make up the majority of metal waste, and include appliances, packaging, construction materials, transportation parts and manufacturing processes.[17] Aluminum is used for packaging and containers, foil, food and drink cans, furniture, and appliances.[18] Nonferrous metals are recovered when batteries are recycled.[19] Most metals can be recycled, and do not lose their quality when repurposed. By creating more comprehensive metal recycling programs and educating the public about these programs, this can cut waste by almost 9%. Recycling not only reduces the need for landfills and incinerators but also preserves new raw materials used to make metals; remelting of scrap and recycled metals saves energy as opposed to manufacturing new metals. For example, recycling aluminum uses 95% less energy compared to producing new aluminum products; recycling steel and tin can save 60-70% in comparison to producing virgin materials.[20] It is also estimated that recycling metals is a cheaper alternative to producing new metal goods with raw materials, benefitting production companies and metal manufacturers. An update to the state’s bottle bill to include more beverages and a higher redemption rate can increase metal recycling.
Wood (6.2%):
An estimated 350,354 tons of wood were disposed of in Massachusetts in 2018. Clean wood can be recycled instead of trashed. Recycling is a more sustainable option not only to reduce the size and scope of our landfills, but also because burning wood releases climate change-fueling carbon dioxide pollution due to wood’s organic, carbon-rich matter. Wood can also be composted in small quantities, larger pieces needing to be broken down first. When recycled, wood can be repurposed into mulch, furniture, bedding material, and construction materials. It is also used to make composite board or engineered wood, often a more cost-effective option for consumers compared to freshly processed wood or repurposed, pure wood.
Textiles (5.8%):
Our state generates over 329,000 tons of textiles every year,[21] though textiles can easily be recycled and repurposed, extending the life of the material as opposed to sending it to a landfill or incinerator. Local governments should create a textile recycling curbside pick-up program to encourage textile recycling. Another end point for textiles is donation of used clothing to second-hand clothing shops, extending the life and wear of the particular garment. This should be encouraged and accessible by creating readily available clothing drop-off stations.
When recycled, textiles can be repurposed in many useful ways, creating jobs and fueling local businesses. Forty five percent of donated textiles are sold to charities or for-profit textile recyclers who resell the textiles to overseas markets.[22] Another 30% are repurposed into industrial cloths. Companies like ERC Wiping Products in Lynn, MA specialize in this. The remaining 20% of donated textiles are sent to fiber converters like Millbury Textile Recycling. In Massachusetts, there are at least 25 organizations, manufacturers, and companies that specialize in repurposing and recycling textiles. Keeping textiles out of landfills is also the most cost-effective way to manage textile waste, and already companies in our state are demonstrating the economic and job creation benefits of Zero Waste programs as well as the potential market for recycled textiles.[23]
Glass (4.2%):
Glass is 100% recyclable, and can easily be melted down and transformed without losing its original quality.[24] Glass should not be a waste ‘category’ at all, but approximately 237,000 tons of glass were disposed of in 2018. We need better comprehensive recycling programs in Massachusetts to keep glass out of landfills. When one glass bottle enters a landfill, it is estimated to take over 1 million years to break down.[25] Recycled glass is less costly for manufacturers, and melts at a lower temperature, requiring 30% less energy than non-recycled glass.[26] Glass also uses sand in its production, and the environmental toll of mining sand is another incentive to recycle glass material. The extraction of sand damages riverbeds, partially drains bodies of water thus making them more prone to droughts, and can disrupt coastal ecosystems and wildlife.[27] It is essential that glass is recycled as opposed to being a single-use item because of its environmental and economic impacts.
In order to increase glass recycling, Massachusetts needs to update its bottle bill. Bottle bills were first introduced in several states in the early 1970s, and as a result recycling rates of cans and bottles have increased due to the economic incentive. However, the bottle bill is in sore need of an update to account for changes in the past few decades. In Massachusetts, the bottle bill was first issued in 1981 and the deposit amount for each recycled can or bottle is still only 5¢.[28] In order to continue incentivizing recycling, the deposit amount should increase to reflect current economic value. Additionally, the bottle bill needs to include different types of food and beverage containers to be more effective. The current Massachusetts bottle bill does not include plastic water bottles, tea, or sports drinks. It is estimated that states with bottle bills recycle 60% of beverage containers, whereas states without this policy only have a 24% beverage recycling rate.[29] Massachusetts is already on the right track by having it’s current bottle redemption system, and recycling can increase if the bottle bill is revised.
Rubber and Leather (3.1%):
Around 177,000 tons of rubber and leather were disposed of in 2018. Leather and rubber both have the potential to be recycled, and many companies specialize in creating products made from recycled leather or rubber, like FBS Tire Recycling, Inc in Ayer. Used leather goods including shoes, belts, and articles of clothing can also be donated to second-hand shops, giving the goods a second life.
Conclusions
For a healthier world, we need to commit to a Zero Waste future: a vision that includes minimizing waste, maximizing recycling and composting and incentivizing the products that can be reused or recycled. Although Zero Waste may seem like a lofty goal, the Commonwealth can drastically reduce waste through changes in policy and waste awareness. Communities on the frontlines are already experiencing the damaging effects of our waste crisis, and we need to act boldly and urgently to help our communities and planet.
Recommendations for Achieving a Zero-Waste Vision include:
[1] https://www.mass.gov/doc/draft-2030-solid-waste-master-plan/download
[2] https://onlinelibrary.wiley.com/doi/full/10.1111/1753-6405.12939
[3] https://www.epa.gov/anaerobic-digestion/basic-information-about-anaerobic-digestion-ad
[4]https://www.ecocyclesolutionshub.org/wp-content/uploads/2015/06/Curbside-Organic-Waste-Program-for-Hamilton-and-Wenham.pdf
[5] https://www.epa.gov/transforming-waste-tool/zero-waste-case-study-san-francisco
[6]http://www.worcesterma.gov/trash-recycling/composting#:~:text=The%20City%20of%20Worcester%20has,leaf%20and%20yard%20waste%20collection.
[7]https://www.mass.gov/doc/map-list-of-massachusetts-sites-accepting-diverted-food-material-august-2020/download
[8] https://recyclingworksma.com/how-to/materials-guidance/recycle-paper/
[9]https://www.epa.gov/facts-and-figures-about-materials-waste-and-recycling/paper-and-paperboard-material-specific-data#:~:text=The%20total%20generation%20of%20paper,to%20other%20materials%20in%20MSW.
[10] https://archive.epa.gov/wastes/conserve/materials/paper/web/html/faqs.html#states
[11] https://www.paperrecycles.org/statistics/where-recovered-paper-goes
[12] https://archive.epa.gov/wastes/conserve/materials/paper/web/html/grade.html
[13] https://www.recyclingproductnews.com/article/31882/surviving-the-changing-mixed-paper-market
[14]https://www.epa.gov/facts-and-figures-about-materials-waste-and-recycling/plastics-material-specific-data
[15]https://web.archive.org/web/20181224092346/https:/www.des.nh.gov/organization/divisions/water/wmb/coastal/trash/documents/marine_debris.pdf
[16]https://engineering.mit.edu/engage/ask-an-engineer/can-we-safely-burn-used-plastic-objects-in-a-domestic-fireplace/
[17]https://www.epa.gov/facts-and-figures-about-materials-waste-and-recycling/ferrous-metals-material-specific-data
[18]https://www.epa.gov/facts-and-figures-about-materials-waste-and-recycling/aluminum-material-specific-data
[19]https://www.epa.gov/facts-and-figures-about-materials-waste-and-recycling/other-nonferrous-metals-material-specific-data
[20] https://archive.epa.gov/epawaste/conserve/smm/wastewise/web/html/factoid.html
[21] https://www.mass.gov/guides/massdep-textile-recovery#-textiles-by-the-numbers-
[22] https://www.mass.gov/doc/massdep-fact-sheet-used-textiles-a-valuable-resource/download
[23] https://www.mass.gov/doc/massdep-fact-sheet-used-textiles-a-valuable-resource/download
[24]https://nepis.epa.gov/Exe/ZyNET.exe/10001B00.txt?ZyActionD=ZyDocument&Client=EPA&Index=1986%20Thru%201990&Docs=&Query=&Time=&EndTime=&SearchMethod=1&TocRestrict=n&Toc=&TocEntry=&QField=&QFieldYear=&QFieldMonth=&QFieldDay=&UseQField=&IntQFieldOp=0&ExtQFieldOp=0&XmlQuery=&File=D%3A%5CZYFILES%5CINDEX%20DATA%5C86THRU90%5CTXT%5C00000004%5C10001B00.txt&User=ANONYMOUS&Password=anonymous&SortMethod=h%7C-&MaximumDocuments=1&FuzzyDegree=0&ImageQuality=r75g8/r75g8/x150y150g16/i425&Display=hpfr&DefSeekPage=x&SearchBack=ZyActionL&Back=ZyActionS&BackDesc=Results%20page&MaximumPages=1&ZyEntry=5
[25] https://archive.epa.gov/epawaste/conserve/smm/wastewise/web/html/factoid.html
[26] https://archive.epa.gov/epawaste/conserve/smm/wastewise/web/html/factoid.html
[27] https://e360.yale.edu/features/the-hidden-environmental-toll-of-mining-the-worlds-sand
[28] https://www.ncsl.org/research/environment-and-natural-resources/state-beverage-container-laws.aspx
[29]http://www.container-recycling.org/index.php/issues/bottle-bills#:~:text=Did%20you%20know%20that%20states,this%20important%20type%20of%20legislation.